A close-up of dry, cracked, yellow earth, littered with pebbles and a few dead shoots of plants

Economic Exposure

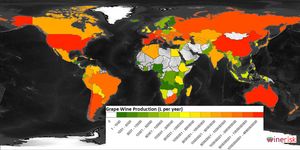
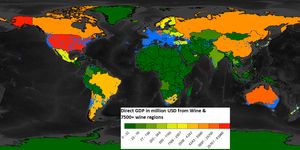
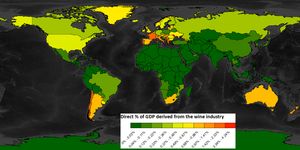
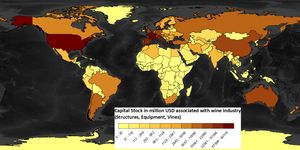
As basic research for the model, economic exposure was needed. The collected data is presented including wine production per year from various sources such as FAO, WineInstitute, OIV and own estimates.

A chart plotting wine production for wine regions around the world
Wine regions and production
A chart plotting wine production as a percentage of GDP for wine regions around the world
Direct GDP for the wine industry in each country in million USD
A chart plotting Direct GDP for the wine industry for wine regions around the world
Percentage of the GDP derived via the wine industry in each country
A chart plotting percentage of the GDP derived via the wine industry for wine regions around the world
Capital stock associated with the wine industry in each country